Features
Everything you need for comprehensive system monitoring
Smart Notch Integration
Seamless integration with macOS notch area for elegant system monitoring

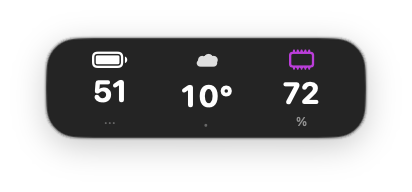
Compact Mode
Unified metrics display in the notch area with elegant glass effect styling.
- Battery, CPU, and Memory percentages
- Optional temperature peeks and upcoming-change highlights
- Integrated with system design language
- Minimal visual footprint
- Always accessible in notch area

Expanded Mode
Detailed system status with health indicators and cycle count information.
- System health status (Optimal)
- Battery cycle count tracking
- Health scoring system
- Optional weather row with “up next” highlights
- Comprehensive at-a-glance metrics
Desktop Widgets
Multiple beautifully designed widgets for comprehensive system monitoring

System Glance
Compact horizontal layout displaying essential system metrics in a minimalist design.
- Battery, CPU, and Memory percentages
- Optional weather swap-in during peeks/highlights
- Compact horizontal format
- Glass effect background
- Essential metrics only
- Clean, minimal design
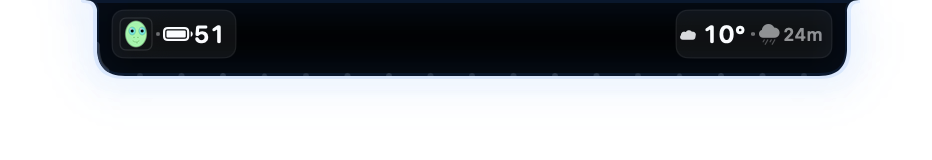
Weather Peek
When Weather is enabled, System Glance can temporarily swap in the current temperature and the next change.
- Condition glyph + temperature
- Upcoming-change indicator
- Designed to be power-safe (low FPS / gated)

System Status
Three-column detailed view with comprehensive system monitoring and semantic color indicators.
- Battery, CPU, and Memory columns
- Semantic color system (green/blue/purple)
- Detailed percentage displays
- Professional monitoring layout

System Dashboard
Comprehensive metrics display with health status, cycle count, and optimal system indicators.
- System health status (Optimal)
- Battery cycle count tracking
- Complete metric overview
- Ultimate monitoring solution
Weather (Optional)
Get the current temperature and upcoming changes without leaving your workflow.
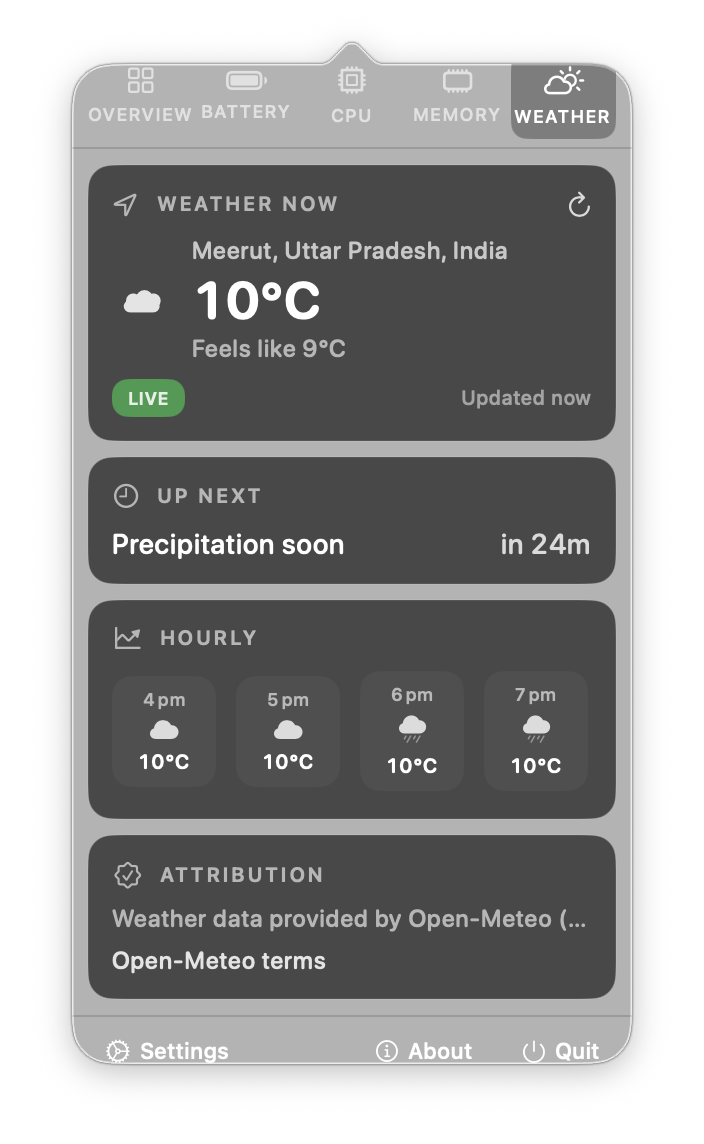
Weather Tab
Current temperature, “up next”, and an hourly strip in the menu bar popover.
- Manual location search + optional current location
- Multiple saved locations
- °C/°F units + refresh interval
- Attribution links for data sources
Smart Notch & Compact Surfaces
Optional peeks and highlights in compact surfaces (Smart Notch + System Glance widget).
- Weather highlights + cooldown
- Occasional temperature peeks
- Pinned temperature option in compact notch
Notch Glow Alerts
Subtle animated glow around the notch for key battery, weather, and device events.
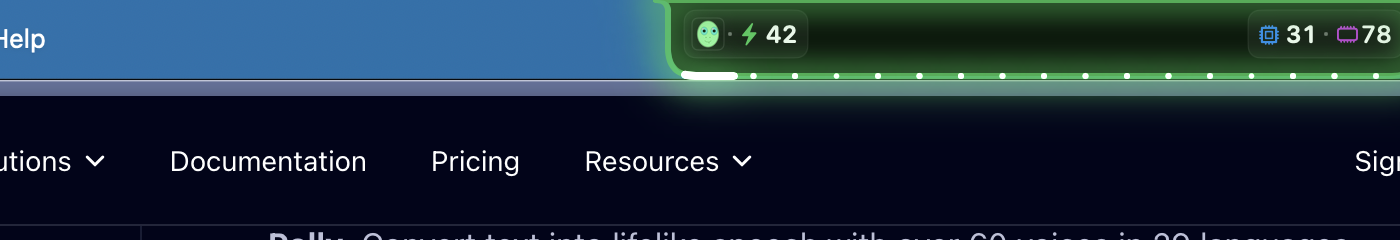
Event Feedback
Microverse can show a gentle glow + sweep + sparkles around the notch when important changes occur.
- Charger connected / Fully charged
- Battery drops below 20%
- Battery critically low (≤10%)
- AirPods low battery (optional)
- Upcoming weather changes (optional)
- Optional RGB startup animation
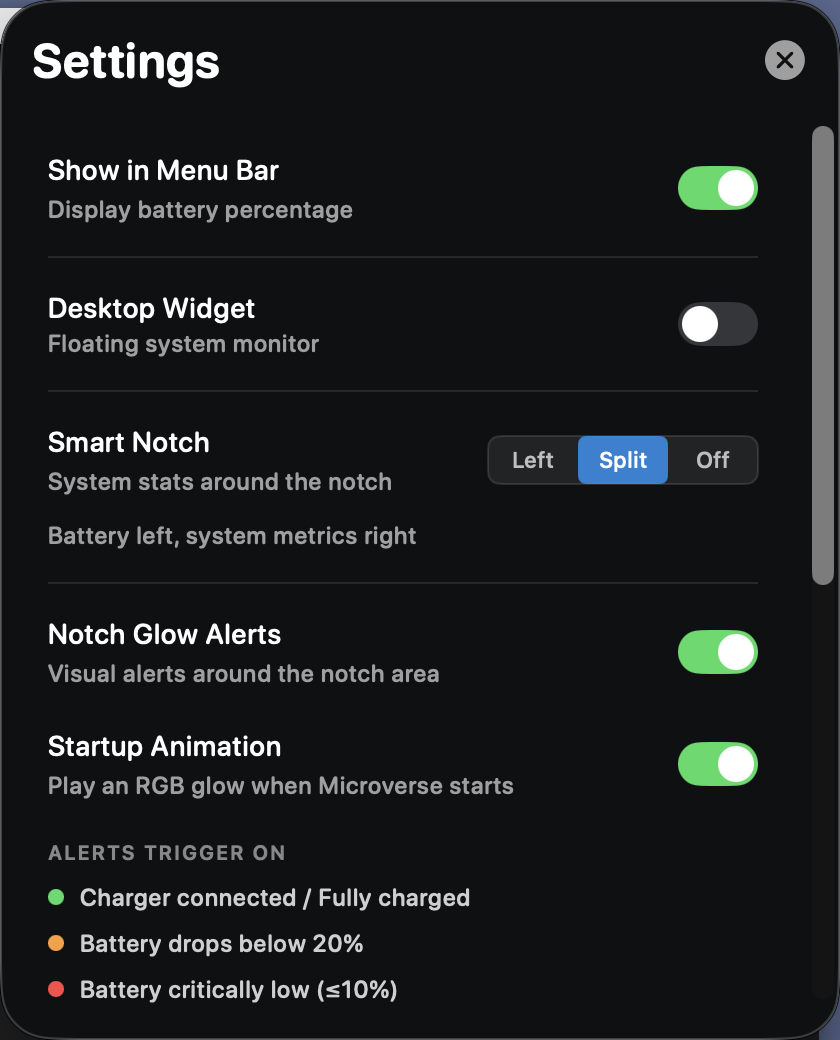
Configurable
Control Smart Notch and Notch Glow Alerts from Settings.
- Enable/disable glow alerts
- Enable/disable startup animation
- Battery thresholds + device rules
- Weather alert lead time + cooldown
- Test alerts on demand
Core Features
Advanced Battery Monitoring
- Real-time charge percentage
- Time remaining estimates
- Cycle count tracking
- Battery health status
- Charging state indicators
- Power adapter detection
CPU Performance Tracking
- Overall usage percentage
- Processor count detection
- Load average monitoring
- Architecture detection (ARM/Intel)
- Real-time updates
- Adaptive refresh rates
Memory Management
- Memory pressure monitoring
- Total and used memory display
- Free memory calculation
- Compression ratio tracking
- Visual pressure indicators
- Color-coded status (Normal/Warning/Critical)
Beautiful Design
- Glass morphism effects
- Semantic color system
- Light/dark mode support
- Smooth animations
- Retina-optimized graphics
- Consistent visual language
Performance Optimized
- < 1% CPU usage
- < 50MB memory footprint
- Adaptive refresh rates
- Battery-aware updates
- No performance impact
- Native SwiftUI efficiency
Privacy First
- No analytics or tracking
- No accounts
- No data collection by Microverse
- Optional network requests (updates + weather)
- Optional permissions (Location + Bluetooth) for specific features
- Local-first processing for system metrics
- Open source transparency
Menu Bar Application
Access detailed system information through an elegant tabbed interface
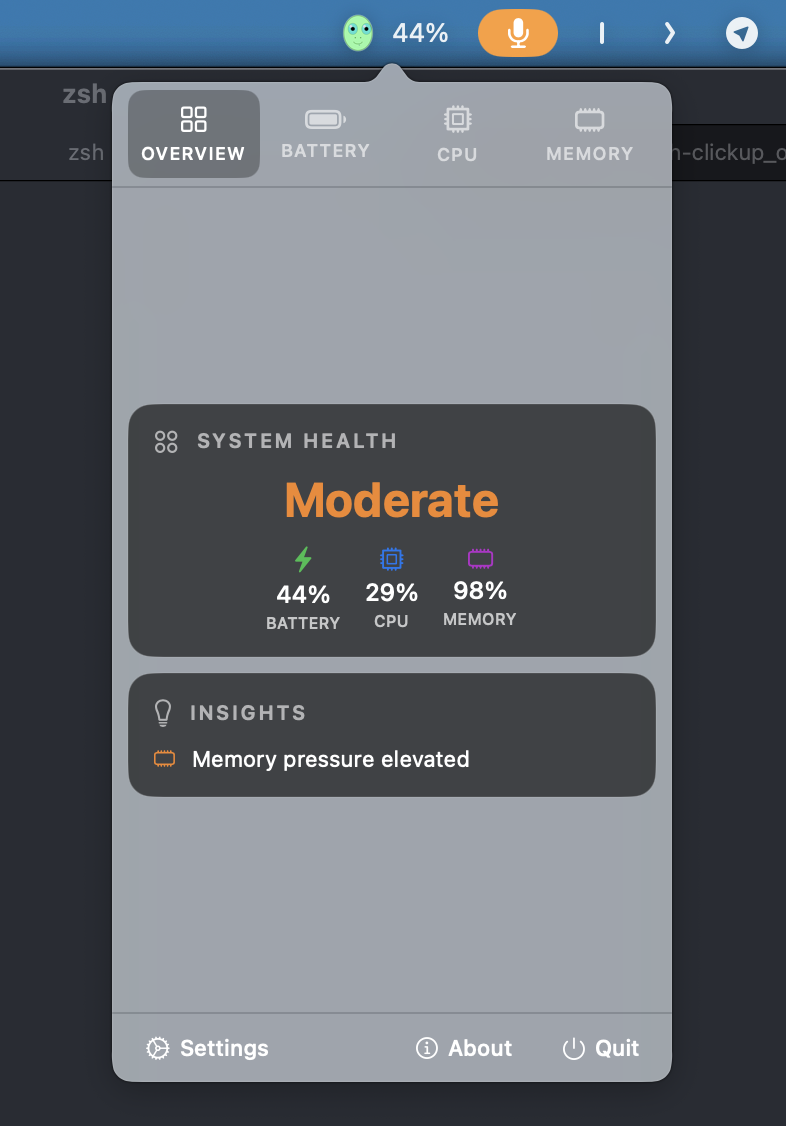
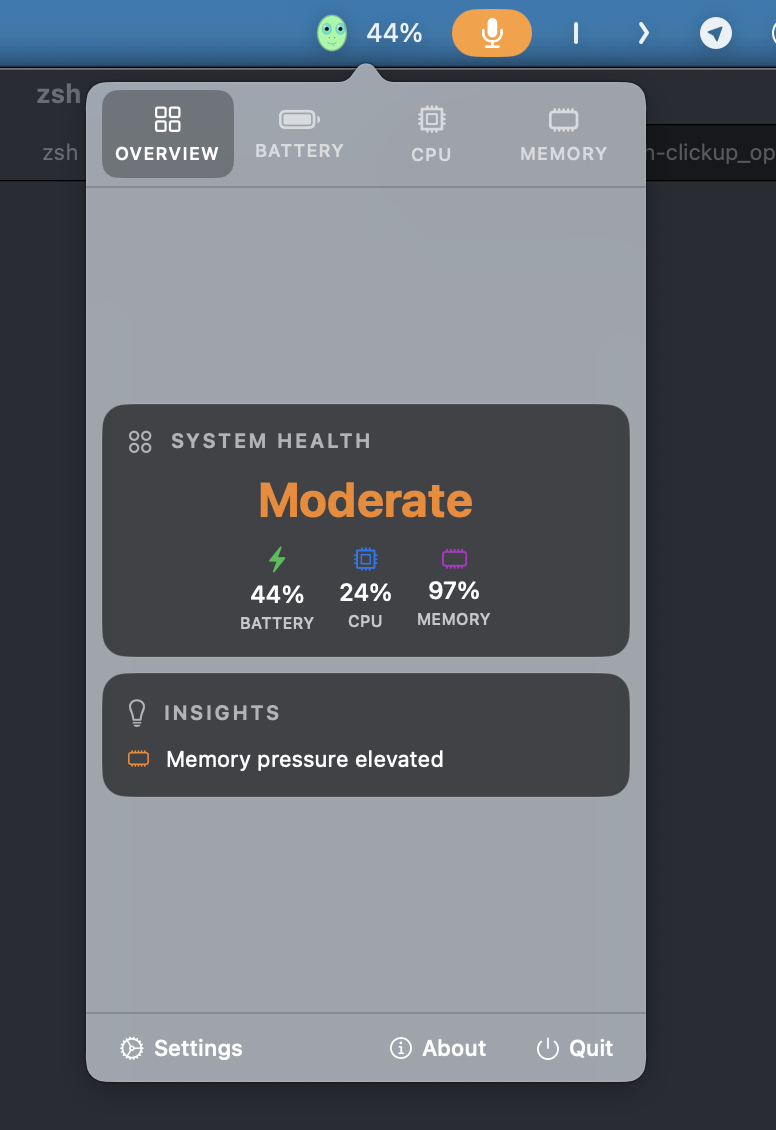
System Overview
Get a comprehensive view of your entire system at a glance. The overview tab provides real-time metrics for all major system components in a clean, organized layout.
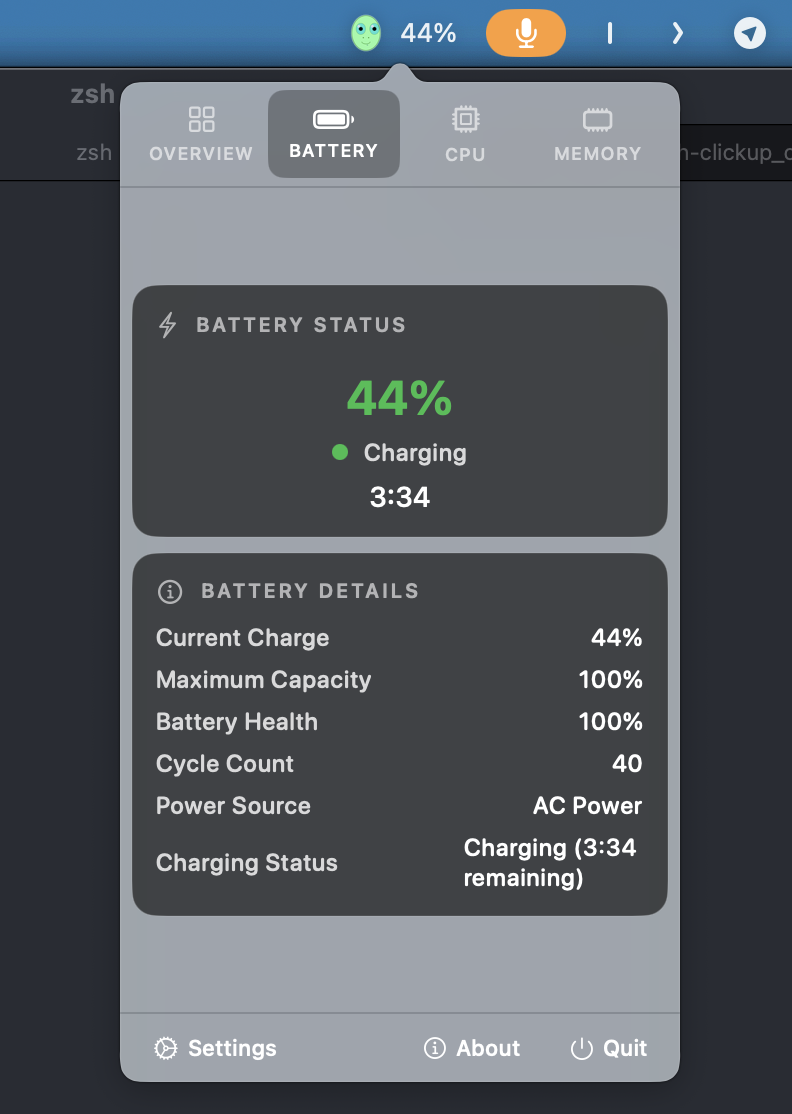
Battery Details
Deep dive into battery health with cycle count, temperature, voltage, and capacity information. Track battery degradation over time and optimize charging habits.
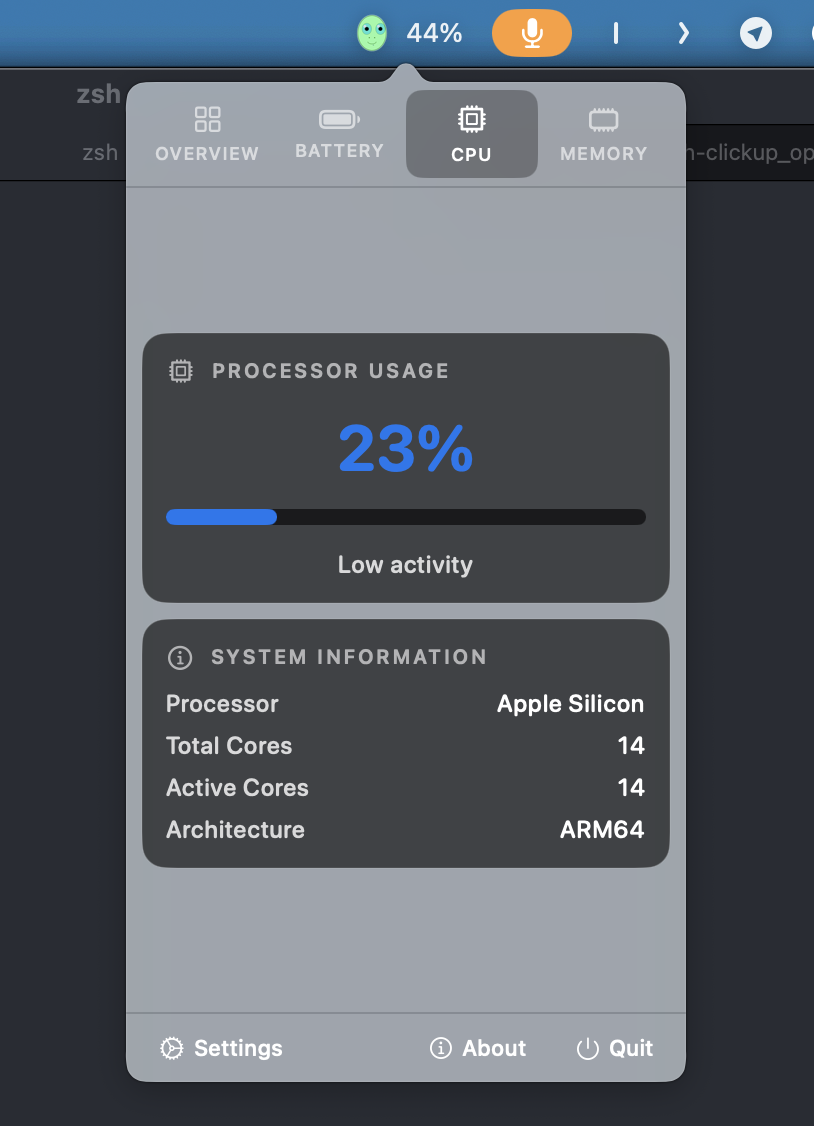
CPU Analysis
Monitor processor performance with per-core usage graphs, system vs user CPU time, and process statistics. Identify performance bottlenecks instantly.
Memory Insights
Understand memory usage patterns with detailed breakdowns of app memory, wired memory, compressed memory, and swap usage. Optimize system performance.
Weather
See the current temperature, “up next” highlights, and an hourly strip — with optional current location, multiple saved locations, and attribution links built in.
Ready to Transform Your Mac Experience?
Download Microverse and start monitoring your system with style